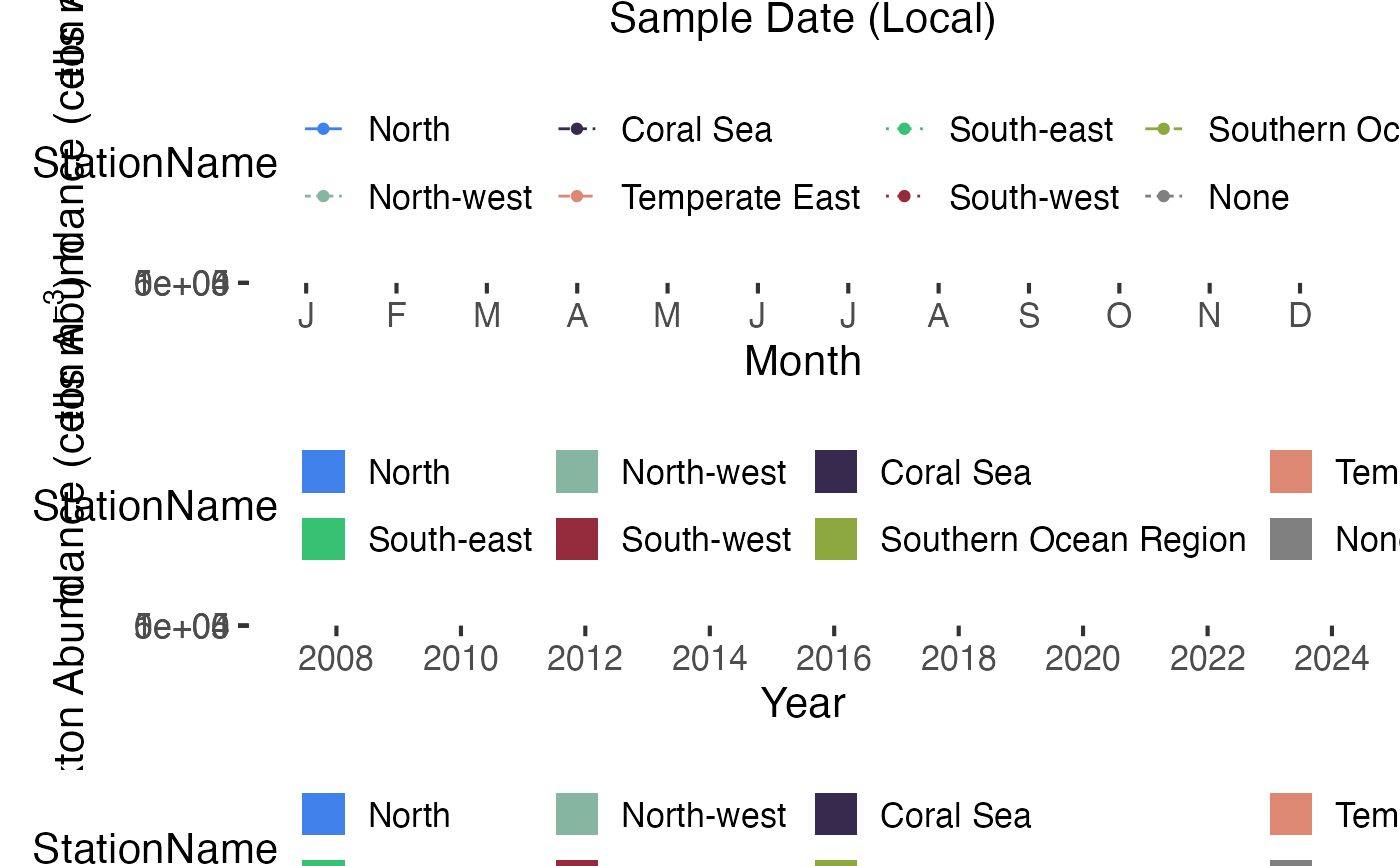
Combined timeseries and climatology plots
pr_plot_tsclimate(df, trans = "identity")Arguments
Value
a combined plot
Examples
df <- pr_get_Indices(Survey = "CPR", Type = "Phytoplankton") %>%
  dplyr::filter(Parameters == "PhytoAbundance_Cellsm3")
pr_plot_tsclimate(df)
#> Warning: Removed 1682 rows containing missing values or values outside the scale range
#> (`geom_line()`).
#> Warning: Removed 25443 rows containing missing values or values outside the scale range
#> (`geom_point()`).
#> Warning: Removed 30 rows containing missing values or values outside the scale range
#> (`geom_col()`).
#> Warning: Removed 70 rows containing missing values or values outside the scale range
#> (`geom_col()`).
