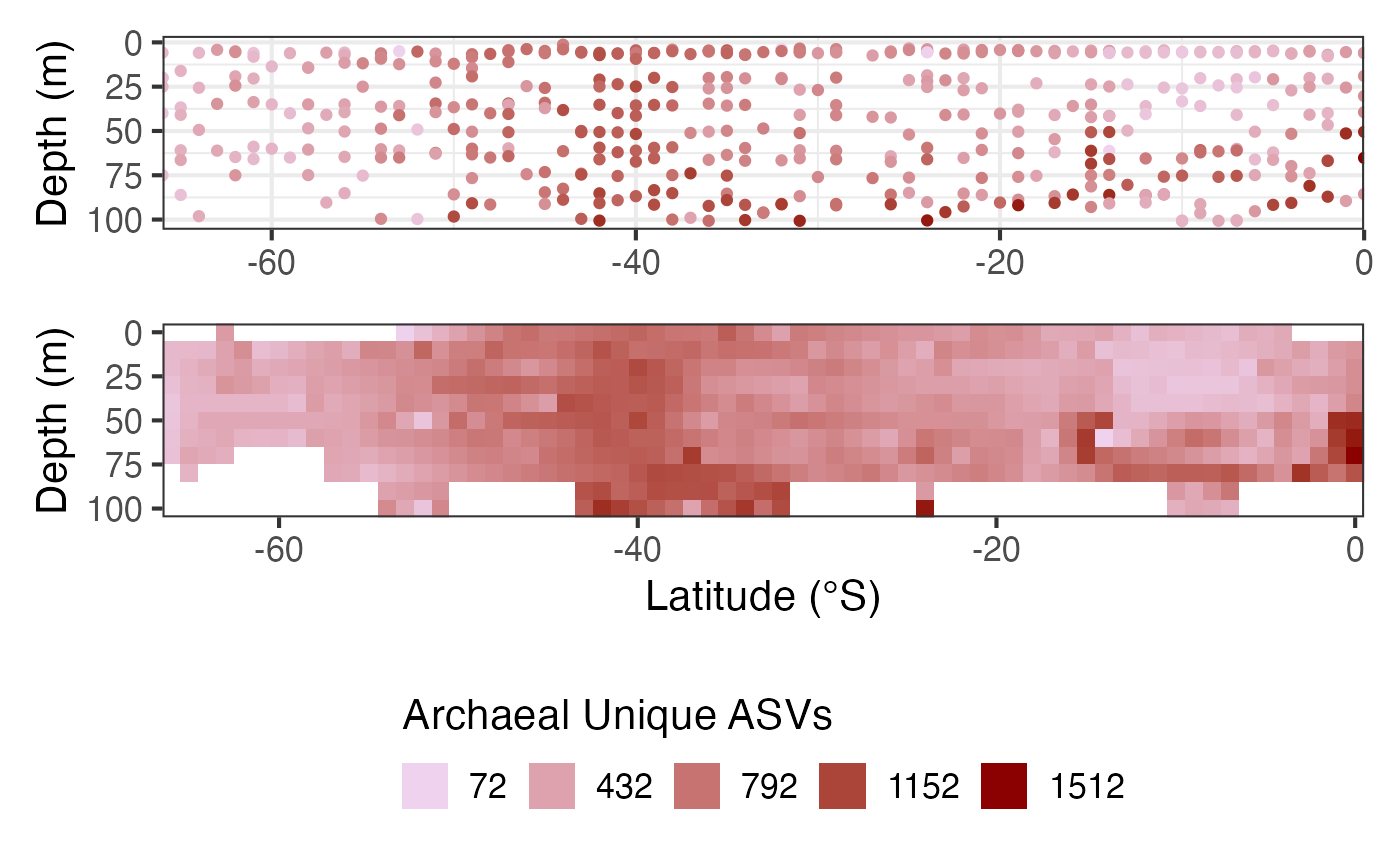
Create Hovmöller diagram showing latitudinal patterns over time
Source:R/plot_timeseries.R
pr_plot_latitude.RdCreate Hovmöller diagram showing latitudinal patterns over time
pr_plot_latitude(df, na.fill = TRUE)Arguments
Value
patchwork object
Examples
df <- pr_get_data(Survey = 'GO-SHIP', Type = 'Micro')
df <- df %>% dplyr::filter(Parameters == 'Bacteria_unique_ASVs',
SampleDepth_m < 101)
pr_plot_latitude(df, na.fill = mean)
#> Warning: Imputing missing values.