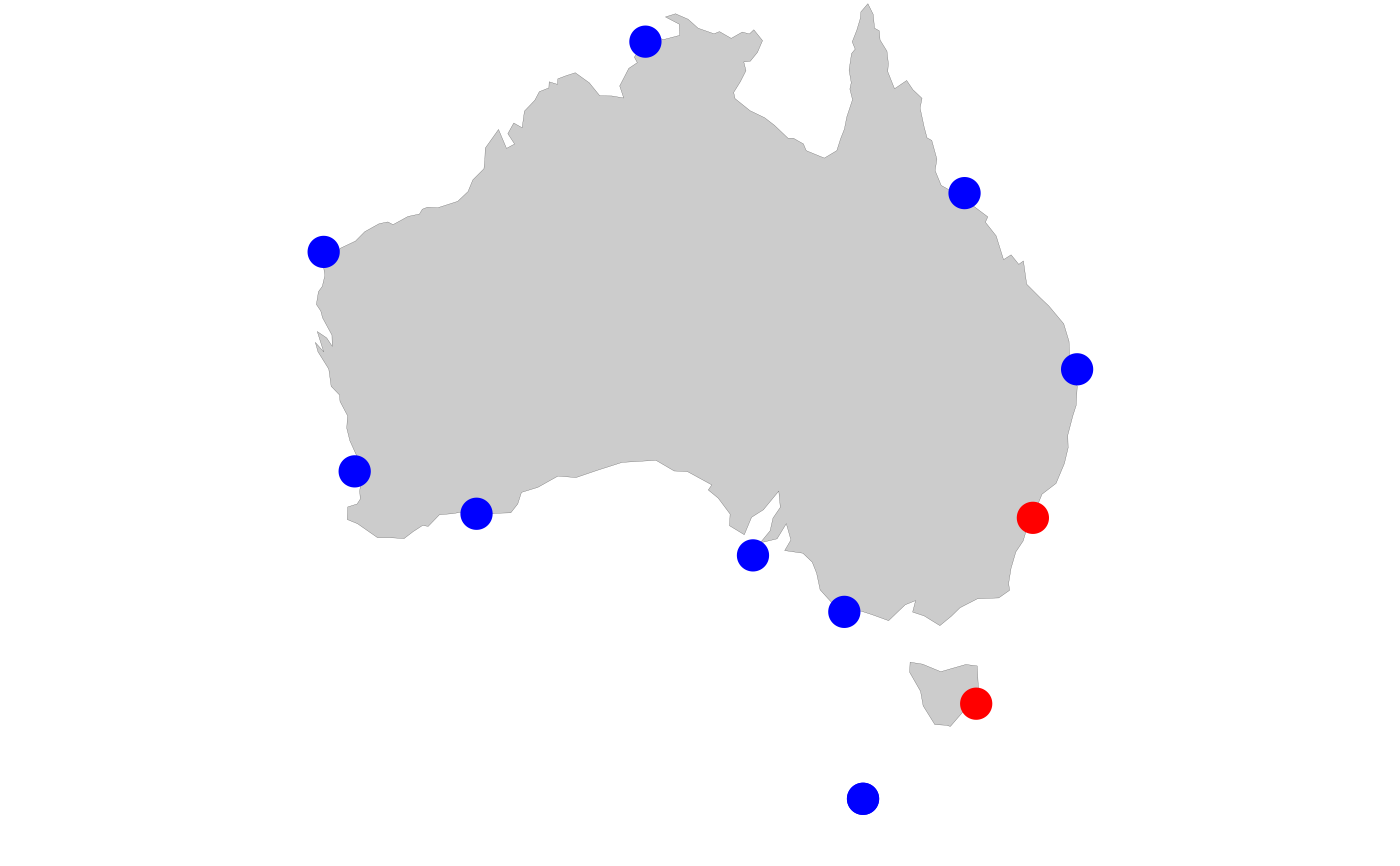
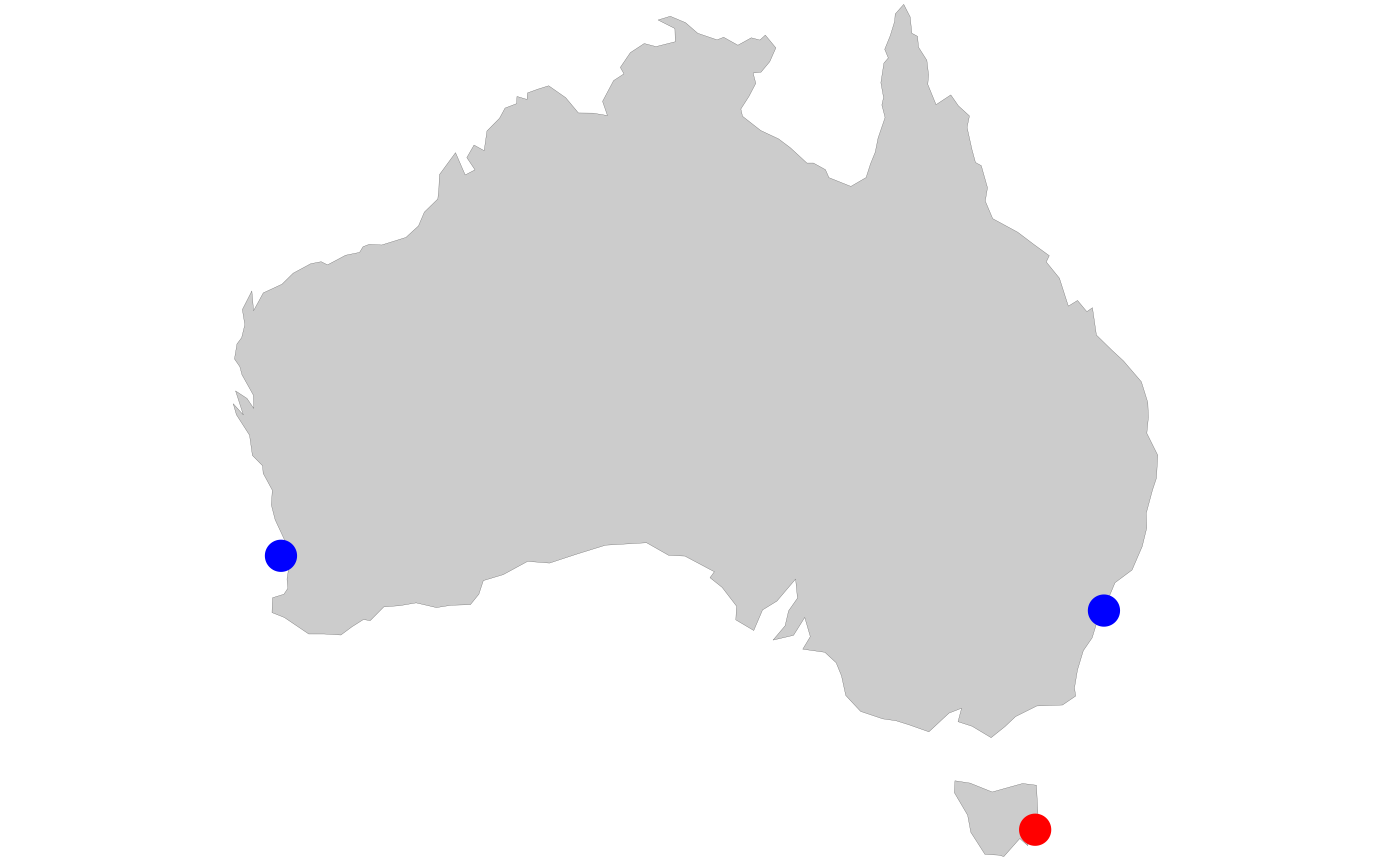
Plot Australian coastline with NRS sampling stations, highlighting selected stations in red and non-selected stations in blue. Useful for showing which stations are included in an analysis or visualisation.
pr_plot_NRSmap(sites, Survey = "NRS", Type = "Zooplankton")Arguments
- sites
Character vector of station codes to highlight. Valid codes:
"DAR"- Darwin"YON"- Yongala"NSI"- North Stradbroke Island"PHB"- Port Hacking"MAI"- Maria Island"KAI"- Kangaroo Island"ESP"- Esperance"ROT"- Rottnest Island"NIN"- Ningaloo
- Survey
Which station network to display:
"NRS"- All National Reference Stations (default)"LTM"- Long Term Monitoring subset (Maria Island, Port Hacking, Rottnest Island)"Coastal"- Coastal stations
- Type
Plankton type, affecting which stations appear:
"Zooplankton"- Standard NRS stations (default)"Phytoplankton"- Includes Southern Ocean Time Series (SOTS) station
Value
A ggplot2 object with transparent background, suitable for overlaying
or saving with ggsave()
Details
Map Extent
The map shows the Australian coastline from:
Longitude: 112.8°E to 154.5°E
Latitude: -44°S to -10.5°S (or -50°S if including SOTS)
Visual Design
Red points: Selected stations (specified in
sitesargument)Blue points: Non-selected stations
Grey land mass
Transparent background for easy integration into documents
See also
pr_get_info()for station metadatapr_plot_CPRmap()for CPR bioregion maps